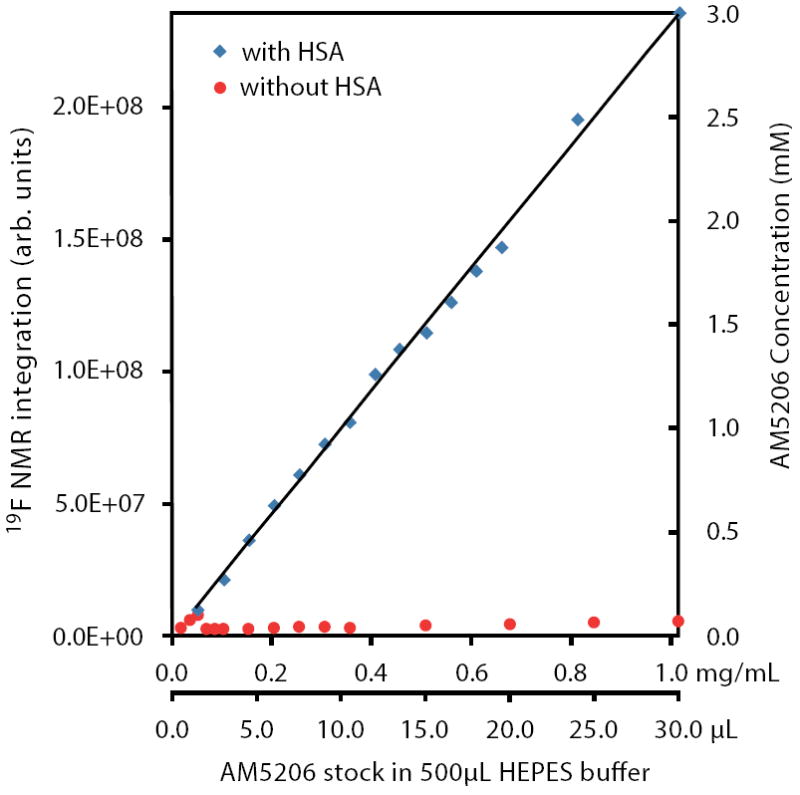
Figure 4.

Integration of 19F-NMR signals from AM5206 in HEPES buffer with HSA (blue squares) and without HSA (red circles). The two horizontal axes represent the actual amount of AM5206 stock solution (50 mM in DMSO) added and the corresponding amount of AM5206 in the NMR sample (mg/mL). The vertical axis on the right shows the concentration of the soluble portion of AM5206.
