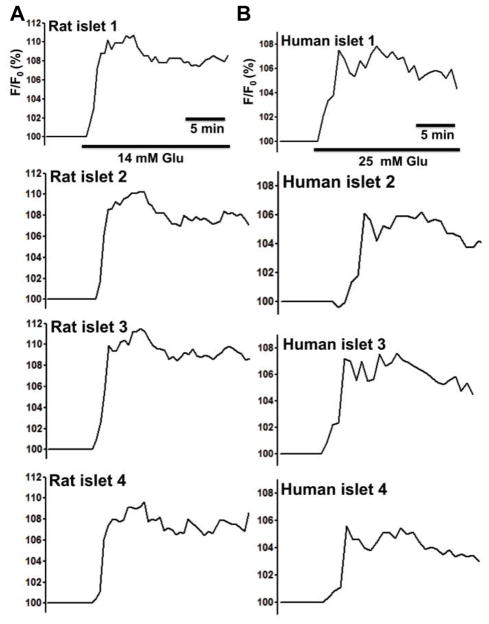
Figure 6. Microencapsulated rat and human islets show heterogeneous NAD(P)H changes of in response to glucose under 21% O2.
(A) Four representative traces of NAD(P)H changes of microcapsulated rat islets in response to 14 mM glucose (n = 65 from three experiments). (B) Four representative traces of NAD(P)H changes of microcapsulated human islets in response to 25 mM glucose (n = 65 from three experiments).

