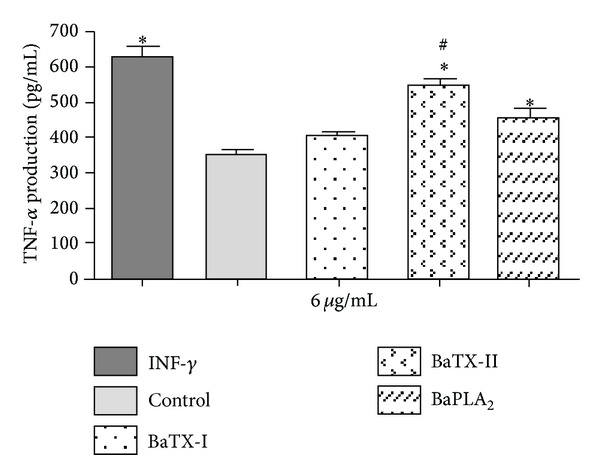
Figure 9.

Effect of BaTX-I, BaTX-II, and BaPLA2 on J774A.1 macrophage TNF-α production. 2 × 10⁵ macrophages were incubated with RPMI (control) or INF-γ (1 µg/mL) (positive control) or toxins (6 µg/mL) for 4 hours. The concentrations of TNF-α in the supernatant were quantified by specific EIA. The results were expressed as pg/mL of TNF-α and represent the mean ± S.E.M from 3 independent experiments. *P ≤ 0.05 compared to control and # P ≤ 0.05 compared to BaTX-II (ANOVA).
