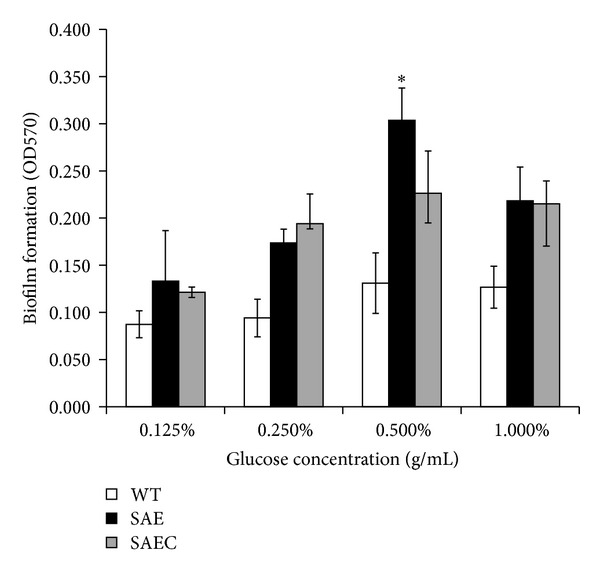
Figure 4.

Effect of glucose on SAE, WT, and SAEC biofilm formation. SAE, WT, and SAEC biofilms were formed in the absence (black bars) or presence of glucose (0.125%, 0.25%, 0.5%, and 1%); then the biofilms were washed and then stained with crystal violet. Their retained biomass was quantified by measuring the absorbance of each well at 570 nm. Mean values and standard deviations from three independent experiments are shown, *P < 0.05.
