
Figure 5.
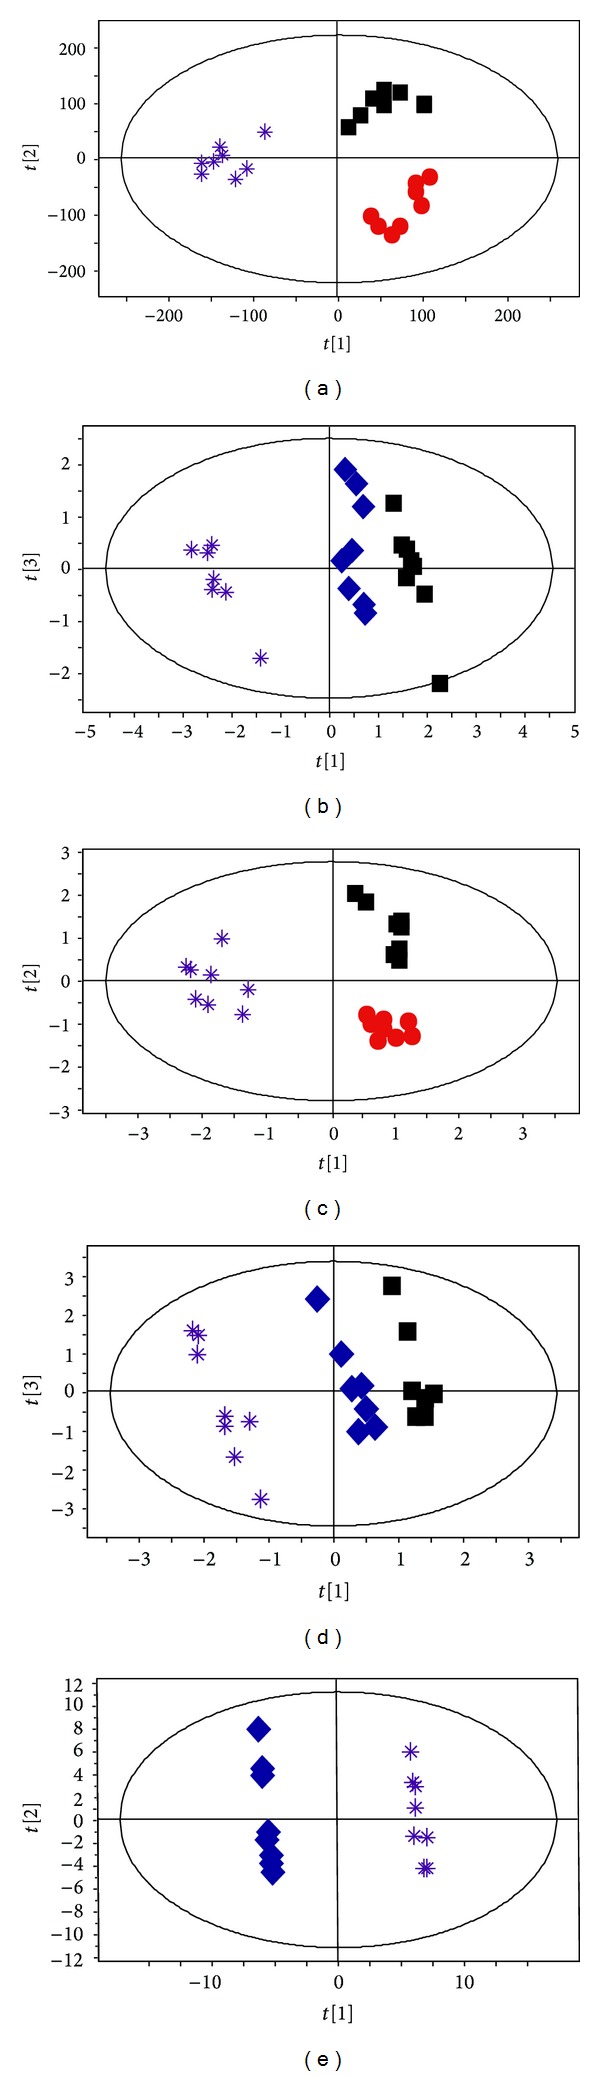
OSC-PLS analysis discriminates clear separation between EA at acupoints and EA at nonacupoints in the acute migraine rat model. NTG group (red dots), EA group (blue diamonds), NA group (purple stars), and control (black boxes) group. CPMG analyses were conducted (a) among three groups and (b) among EA, NA, and control group. LED analyses were conducted (c) among three groups and (d) among EA, NA, and control group and (e) between EA and NA group (n = 10).