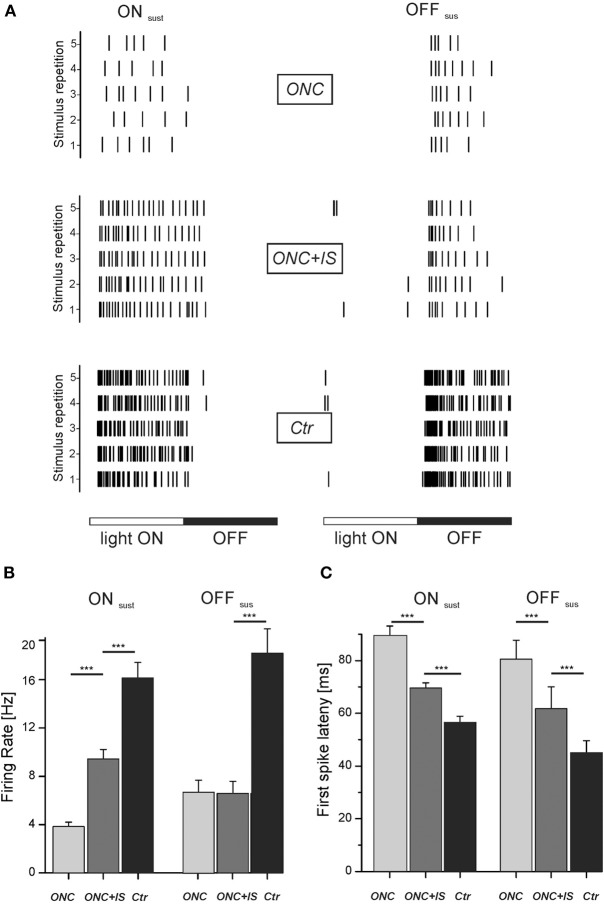
Figure 4.
Light-induced response properties are impaired upon ONC and partially protected by IS. (A) Rasterplots show representative light-responses of RGC to a flash-stimulus. Left column: light-response of an ON sustained RGC of each condition. Right column: light-response of an OFF sustained RGC of each condition. Each tick represents one action potential. Each row represents one stimulus presentation. Stimulus duration is 1000 ms with each phase lasting 500 ms. (B) Mean firing rate of all ONsus and OFFsus RGCs for each condition during the corresponding stimulus phase (light ON vs. light OFF). For ONsus cells, mean stimulus-induced firing rates are significantly different in ONC and ONC + IS retinae (***p < 0.001). Numbers of evaluated RGCs are given in the text. (C) Mean first-spike latency of all ONsus and OFFsus RGCs for each condition. Mean first-spike latency represents the occurrence of the first spike upon stimulus onset averaged over stimulus repetitions. Mean latencies of RGCs from ONC, ONC + IS and control retinae are significantly different (***p < 0.001). Numbers of evaluated RGCs are given in the text.

