Fig. 6.
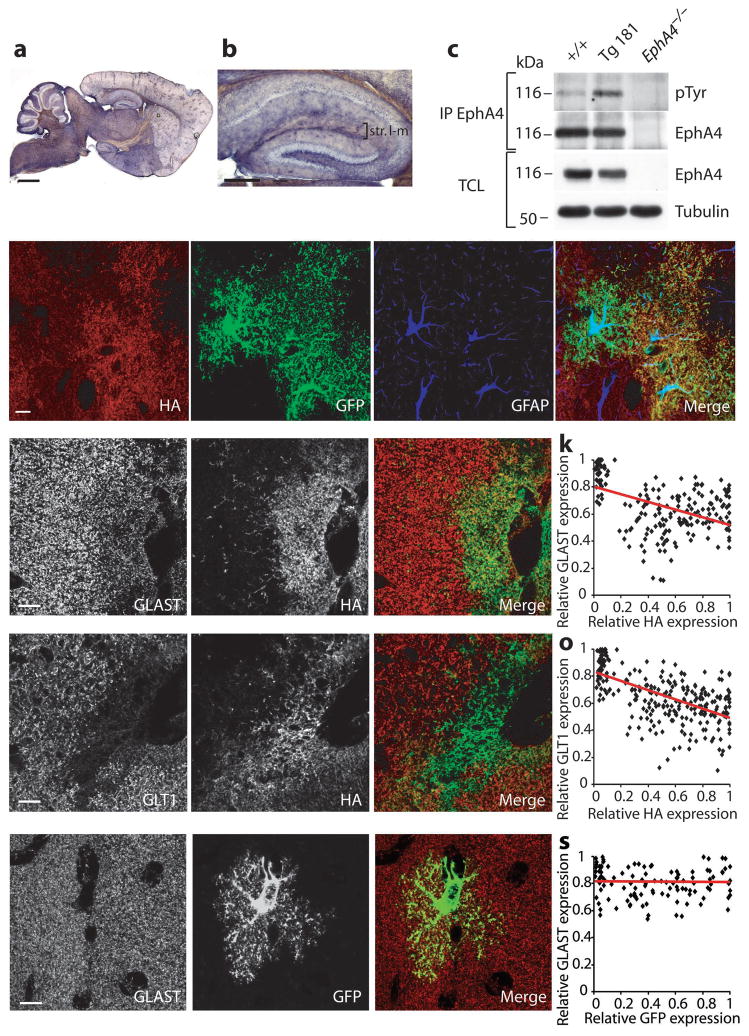
EphrinA3 overexpression in astrocytes reduces glutamate transporters. a,b Anti-HA immunohistochemistry from Tg181 showing scattered distribution of transgenic protein throughout the brain and hippocampus. c, Transgenic ephrinA3 induces higher endogenous phosphorylation of EphA4. EphA4 was immunoprecipitated (IP) from +/+ and Tg181 hippocampal lysates, and blotted with pTyr and EphA4 antibodies. EphA4−/− hippocampal lysates were used as control. Total cell lysates (TCL) of the same fractions show EphA4 and Tubulin levels. d–g, Specific expression of transgenic ephrinA3 in glial cells. Immunofluorescence confocal images of hippocampal sections from adult Tg181 crossed to a GFAP-GFP line 26. Triple labeling for the indicated proteins show colocalization of HA with GFP but not with the cytoplasmic marker GFAP (g) indicating that the transgenic protein is expressed in fine processes of astrocytes. h–j, l–n, Immunofluorescence single plane confocal images showing double labeling for GLAST/HA (h–j) and GLT1/HA (l–n) in the stratum lacunosum-moleculare from Tg181. k,o, Scatter plots showing the negative correlation between GLAST/HA (k) and GLT1/HA relative pixel intensities (o) (GLAST/HA correlation factor=−0.46, n=198 regions, 3 mice; GLT1/HA correlation factor=−0.58, n=280 regions, 3 mice, t-test, p<0.0001). Linear regression lines are represented in red. p–r, Immunofluorescence single plane confocal images showing double-labeling for GLAST/GFP in GFAP-GFP mice. Expression of GLAST (red) is not affected in locations where the levels of transgenic GFP (green) are high. s, Scatter plot showing no correlation between GLAST/GFP relative pixel intensities (correlation factor=−0.02, n=121 regions, 2 mice, t-test, p>0.1). Scale bars: c, 1 mm; d, 300 μm; e–n, 10 μm.

