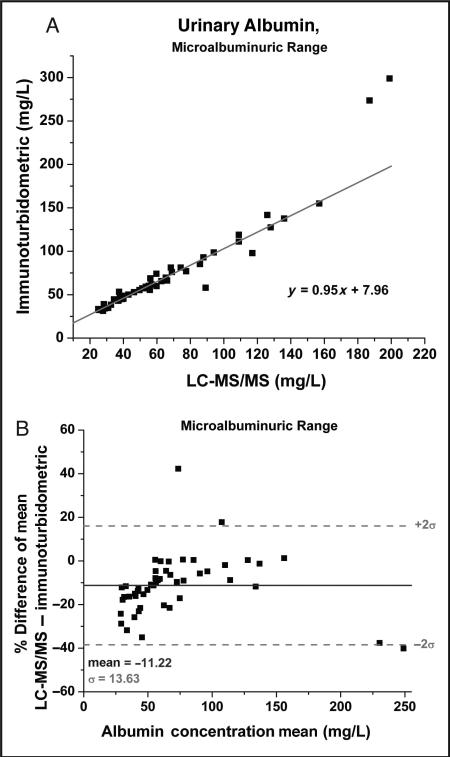
Fig. 4.
Passing–Bablok comparison plot for the microalbuminuric range (25–200 mg/L) of the immunoturbidometric assay vs the LC-MS/MS method using the LVNEVTEFAK y5 peptide transition (575.5–595.6).
Linear regression analysis (not shown) provided the following relationship; y = 1.22x – 6.96, R2 = 0.90 (A) and the corresponding Bland–Altman plot over the microalbuminuric region (B).

