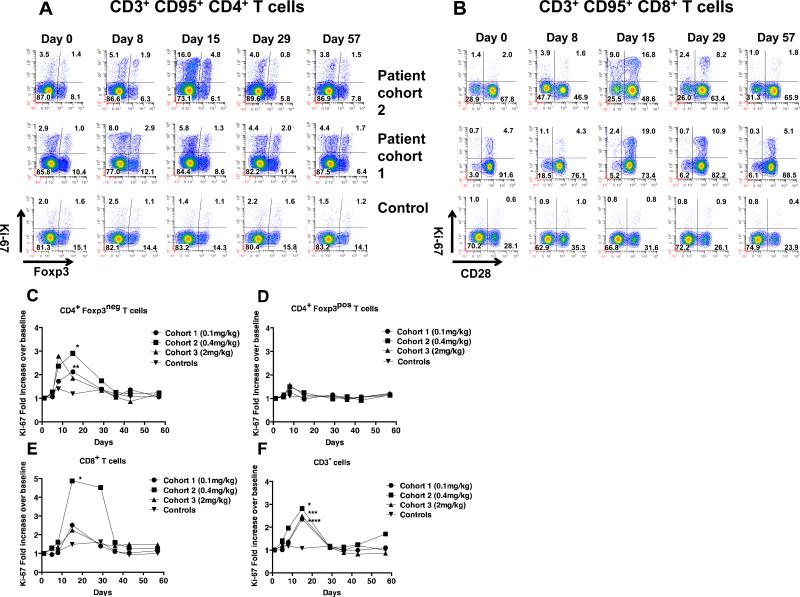
Figure 2. Changes in Ki-67 expression within CD4+ and CD8+ T cell subsets examined over time after anti-OX40.
PBMC were analyzed using a multi-color flow cytometry. (A) Cells gated on CD3+, CD95+, CD4+ analyzed for FoxP3 and Ki-67. (B) Cells gated on CD3+ CD95+, CD8+ T cells analyzed for CD28 and Ki-67. (C-F) Average-fold increase in Ki-67 expression for the four lymphocyte sub-types analyzed. The fold increase was calculated by using Ki-67 percentages on various days following anti-OX40 and dividing it by the percentage of Ki-67+ cells on Day 0 (baseline). Statistical analyses were performed as described in material and methods. * p=0.001, ** p=0.013, *** p=0.004, **** p=0.007.

