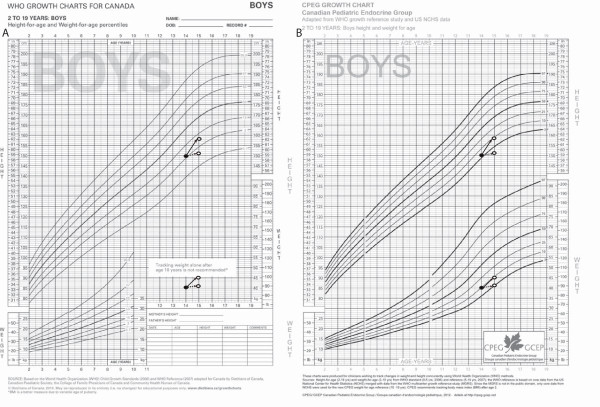
Figure 1.
2010 WHO Growth Charts for Canada and CPEG Growth Charts for Canada. A) ‘2010 WHO Growth Charts for Canada’, height and weight for boys aged 2–19y. Weight-for-age centiles 0.1, 3, 15, 50, 85, and 97 span ages 2–10y. Reprinted with permission. B) CPEG growth charts, height and weight for boys aged 2–19y: After age 10y, weight-for-age centiles 3, 10, 25, 50, 75, 90, and 97 are based on re-analysis of the NCHS-R dataset. To illustrate difficulties in the interpretation of short-term growth changes without a weight-for-age reference, we plot two alternate growth trajectories, identified by solid and dashed arrows. Under both scenarios, the BMI is 18.0 kg/m2 at both the beginning (closed circles) and end (open circles) of the observation period. It is clear that the weight-for-age reference facilitates interpretation of the different trajectories.

