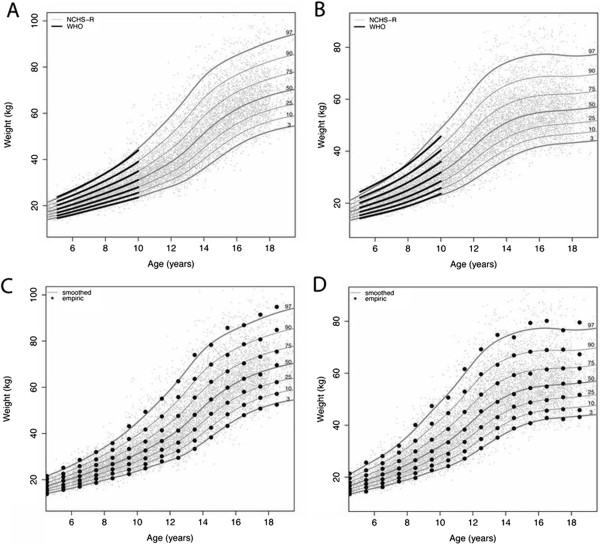
Figure 2.

Comparison of smoothed and empiric centiles: figures A (boys) and B (girls) compare WHO smoothed centiles with those calculated from the NCHS-R dataset. For the latter, smoothed and empiric centiles (data binned by year of age) are compared for boys (C) and girls (D). The individual gray points depict raw data.
