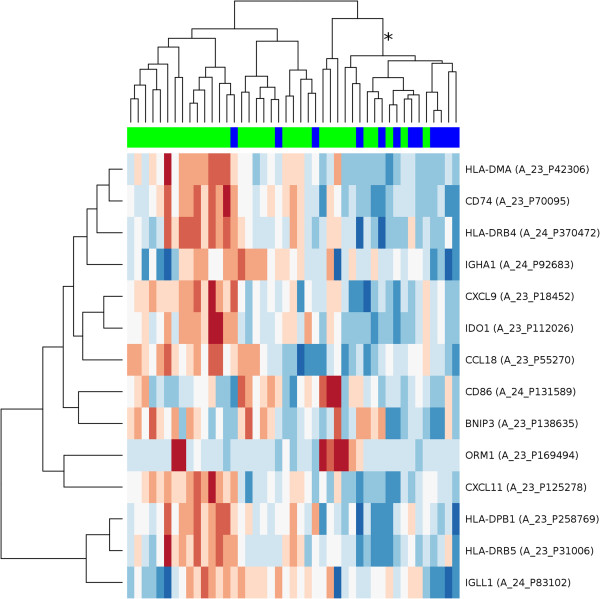
Figure 1.

Clustering of the cohort using 14 selected immune response genes. Hierarchical clustering of 45 colorectal carcinomas, using a gene expression signature composed of 14 genes related to the immune system. Each row represents a probe set for a gene and each column a sample. Samples marked in blue are metastatic cases, samples marked in bright green are cases showing no metastasis at least 3 years after surgery. The length and the subdivision of branches display the relation of the samples based on their similarity in the expression of the 14 genes. Most of the metastatic cases are grouped in the branch marked with the asterisk (*). Metastatic cases have distinctly more of these 14 genes expressed at low expression values (blue, low expression) than non-recurrent patients (red, high expression). The probe hybridization values have been scaled and centered row-wise.
