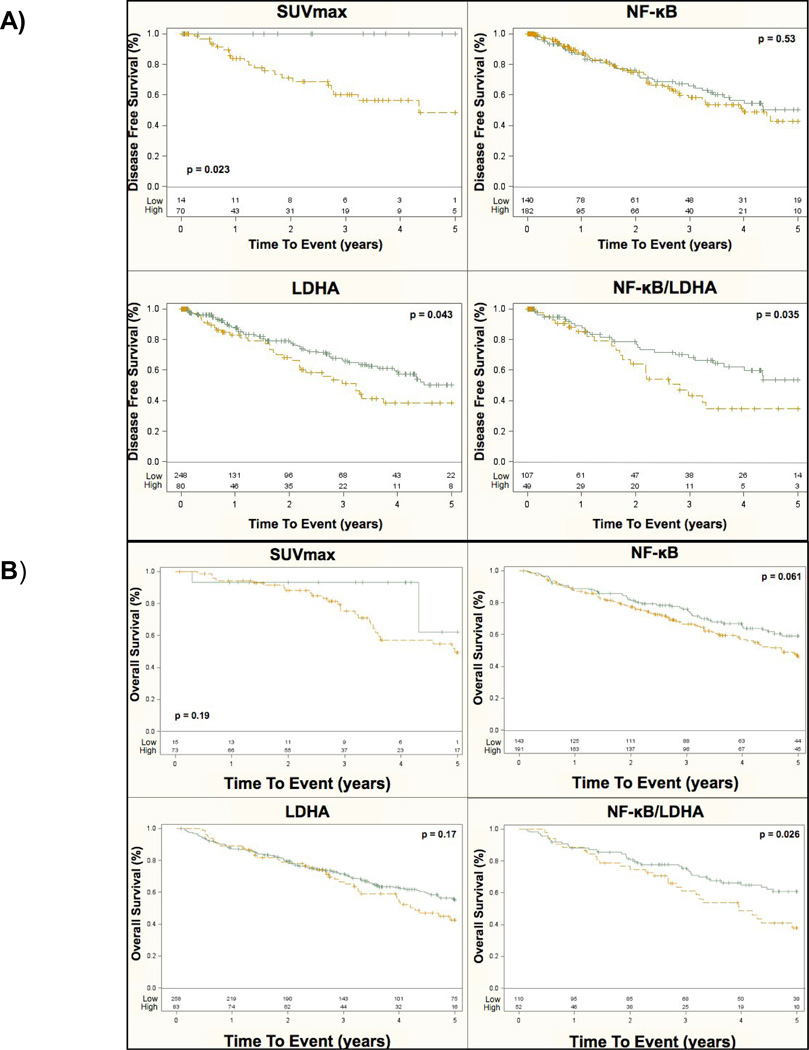
Figure 3.
Kaplan–Meier curves are shown by stage for (A) five-year disease free survival and (B) overall survival for SUVmax, NF-κB, LDHA and NF-κB/LDHA combined expression. The probability of event is on the y-axis and time-to-event is on the x-axis. The number of events is listed at the bottom of each graph and the p-value for significance between groups is shown within each figure. IHC expression levels were combined as high (moderate or high expression levels, yellow line) vs. low (green line) for simplicity of interpretation.

