Figure 4.

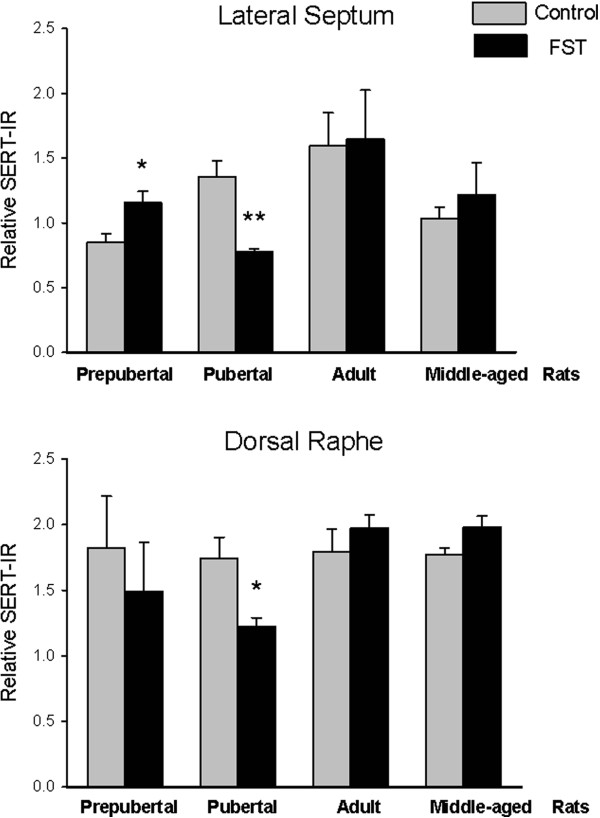
Quantification of SERT-IR in lateral septum (upper graph) and dorsal raphe (lower graph). Data are expressed as mean ± SEM. Results of t test: *p < 0.05, **p < 0.01 groups subjected to FST vs. non-FST (control).

Quantification of SERT-IR in lateral septum (upper graph) and dorsal raphe (lower graph). Data are expressed as mean ± SEM. Results of t test: *p < 0.05, **p < 0.01 groups subjected to FST vs. non-FST (control).