
Figure 8.
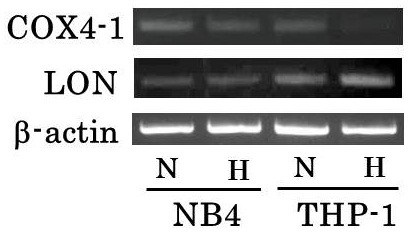
RT-PCR analysis of COX 4–1 and LON on NB4 and THP-1 under normoxia or hypoxia. NB4 and THP-1 were cultured in the same condition as cell proliferation assay for 24 hours. The expression of COX 4–1 in THP-1 under hypoxia was decreased compared with normoxia. In addition, mRNA expression of LON in THP-1 under hypoxia was increased compared with that in normoxia. In NB4, mRNA expression of COX 4–1 and LON was not influenced by O2 concentration. β-actin was performed as an internal control. Top, COX 4–1; middle, LON; bottom, β-actin. H: under hypoxia, N: under normoxia.