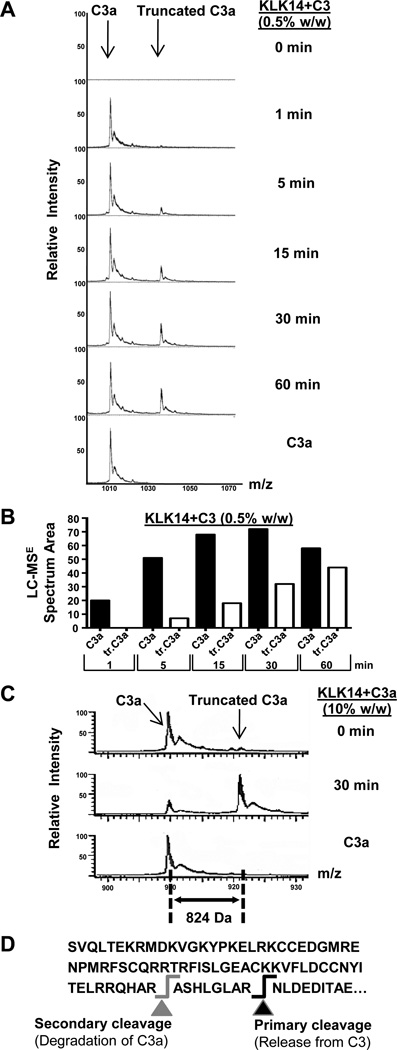
Figure 3. Mass spectrometric identification of the C3a-like fragments released by KLK14.
A) The release by KLK14 of two distinct molecular weight species, C3a and a lower molecular weight C3a component, was investigated by LC-MSE within the 60-min time-frame of incubation with the enzyme. B) A graphical representation of the LC-MSE spectrum area of the C3 fragments proteolytically released by KLK14 (panel A) is shown. Truncated C3a is indicated as tr.C3a. C) Fragmentation of C3a by KLK14 under similar conditions is also shown for comparison purposes. The molar ratio of enzyme to C3 was similar to that of enzyme to C3a, corresponding to a w/w enzyme to C3a ratio of 0.5% for C3 and 10% for C3a. D) The C-terminal part of C3 is indicated, with the cleavage resulting in the release of “active” C3a fragment represented with black arrow and the KLK14-mediated subsequent cleavage shown with a grey arrow. Panels A and C show representative data from two independent experiments with similar results.

