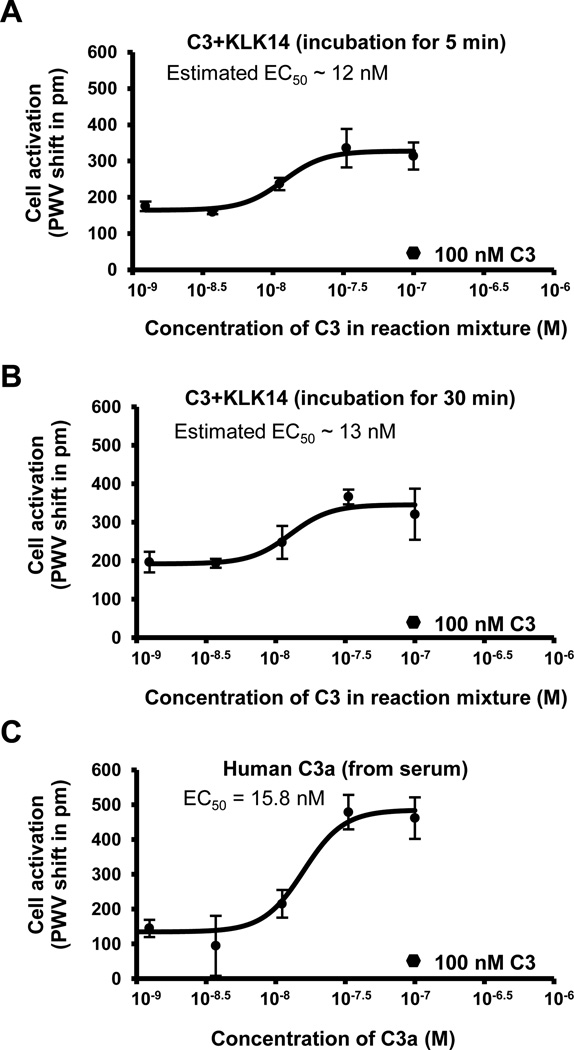
Figure 4. RBL-C3aR cell signaling mediated by the proteolytic action of KLK14.
A–B) Cell responses [peak wavelength value (PWV) shift in pm] triggered by C3aR signals were recorded in response to the KLK14-mediated C3 fragments after 5 min (A) or 30 min (B) of incubation (n=3). The x-axis represents the diluted concentration of C3 that was added to the reaction mixture with KLK14. C) Cell responses triggered by C3aR signals were recorded in response to C3a anaphylatoxin (n=2). The x-axis represents the C3a concentration. A typical cell response (average PWV shift of about 17 pm) to 100 nM of C3 (n=3) is also shown as a black hexagon in these graphs for comparison purposes.

