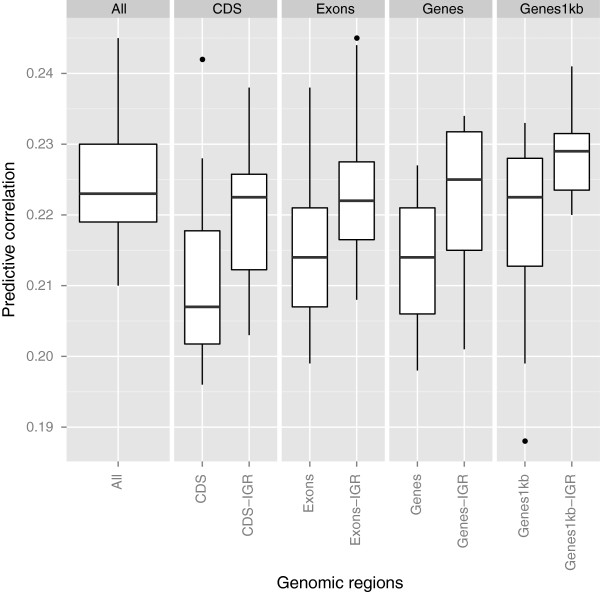
Figure 3.
Predictive correlations comparing genic and non-genic regions for HHP using kernel-based Bayesian ridge regression. The results were based on 10 fold cross-validation with 15 replications for each genomic region. Genic regions were coding DNA sequences (CDS), exons, genes, and genes with 1kb upstream and downstream. The genomic regions followed by the term “IGR” represent intergenic regions that contain equal SNP numbers to those of genic regions. “All” means all SNPs used for constructing G. Outliers denoted as black dots.

