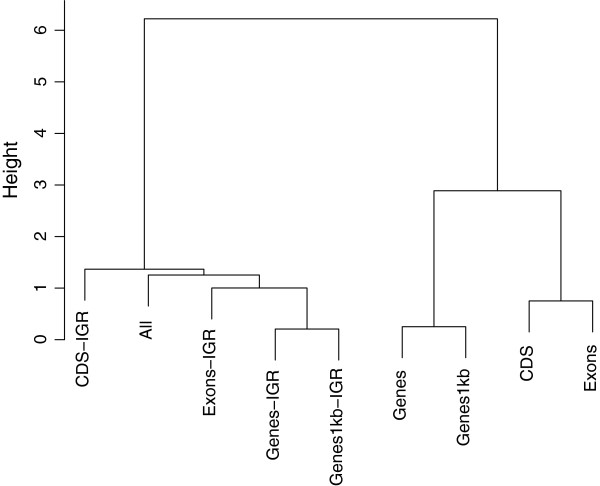
Figure 6.
Hierarchical clustering of predicted genetic values obtained from genic and non-genic regions for HHP. Genic regions were coding DNA sequences (CDS), exons, genes, and genes with 1kb upstream and downstream. The genomic regions followed by the term “IGR” represent intergenic regions that contain equal SNP numbers to those of genic regions.

