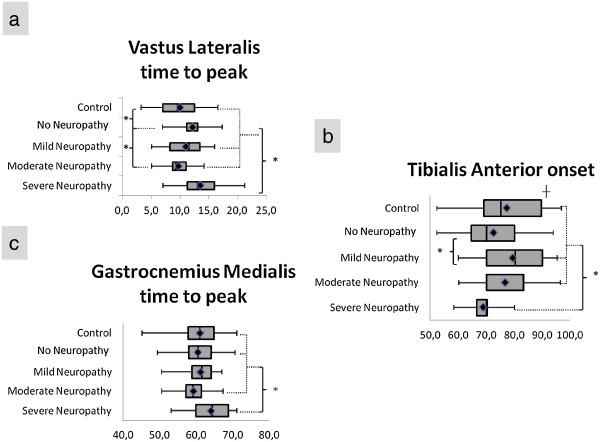
Figure 4.
Temporal variables with statistically significant differences. Box plot with minimum-maximum range of (a) vastus lateralis time to peak occurrence; (b) tibialis anterior onset time; (c) gastrocnemius medialis time to peak occurrence. *Statistically significant difference between groups. ┼ Statistically different group.

