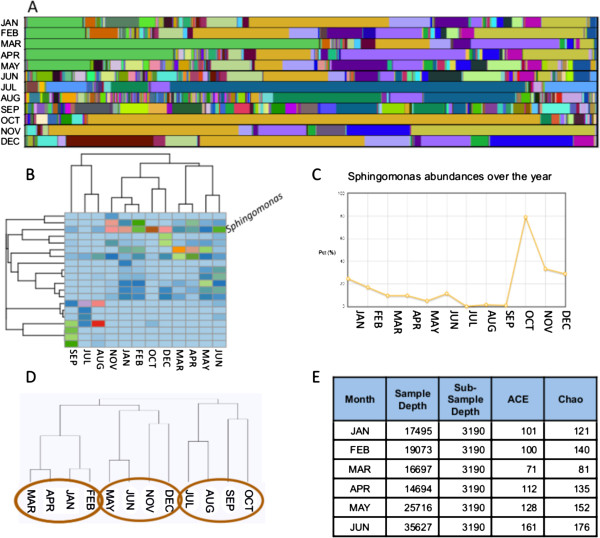
Figure 3.
To illustrate the use of VAMPS, we step through a simplified analysis process using water samples taken at the North Falmouth Fire Station in Falmouth, MA, project RARE_NFF_Bv6v4. Samples were collected monthly over the course of a year (dataset names have been simplified for display). A bar chart of all taxa at the genus level (A) shows several consistent, abundant taxa and a large number of rare taxa particularly during May, June, August, and September. Holding the cursor over a section reveals the taxon name and abundance. For instance, the light green in the upper left is Flavobacterium, the ochre in the middle is Sphingomonas, and the lavender is Undibacterium. A frequency heatmap (B) of abundant taxa (>3% relative abundance in at least one sample) shows a dominant pattern of Sphingomonas, with a lower abundance in the late summer (July-September) than the rest of the year. Oddly, the months of October and November do not cluster together, nor does October cluster with September, or November with December. A graph of Sphingomonas abundances (C) shows a spike in abundance in October and November, with a gradually decreasing abundance throughout the rest of the year. If Sphingomonas is removed from the analysis and the data are reanalyzed in a new dendrogram, the datasets now cluster by season in three groups: late winter to early spring, late summer to fall, and the two transition times of May-June, and November-December (D). Clades are neatly defined by pairs of subsequent months. This implies a possibility of two different microbial community patterns superimposed on one another that warrants further exploration. Finally, the sampling depth and alpha diversity values are exported to a table for reporting (E, July-December not shown).

