
Fig 2.
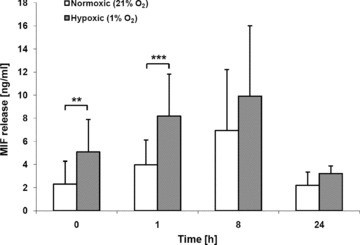
Hypoxia-induced MIF secretion from HAoECs. Experiments were performed essentially as described in the legend to Figure 1. Bars represent mean values (n= 3) ± S.D. Asterisks, * and ***, indicate statistical significance with P < 0.05 and P < 0.005, respectively.