
Fig 5.
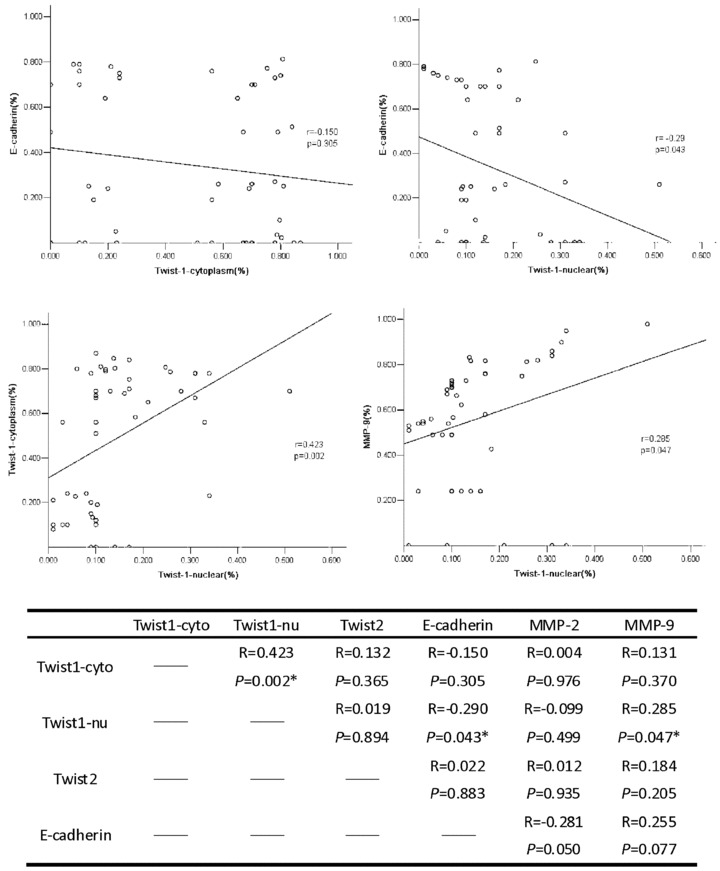
Correlation analysis between Twist1(cytoplasm), Twist1(nuclear), Twist2, E-cadherin, MMP2 and MMP9 expression was tested using the Pearson correlation test. Results show that the Twist1 (nuclear) is correlated with Twist1(cytoplasm), E-cadherin and MMP9 (*P < 0.05).