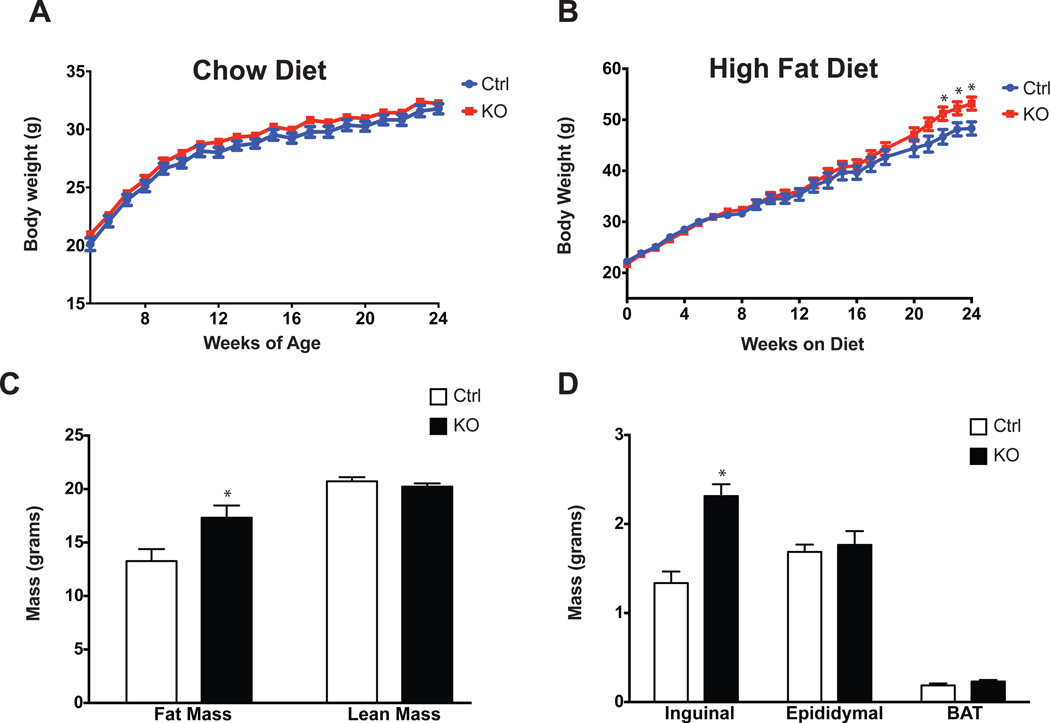
Figure 4. Obesity and Altered Fat Distribution in Adipo-PRDM16 KO Mice.
(A and B) Body weights of Adipo-PRDM16 KO and control mice on standard chow (A) or HFD (B). HFD was started at 4 weeks of age. Experiments were done with male mice, n=12–15 per group.
(C) Body composition of Adipo-PRDM16 KO and control mice following 16 weeks on HFD. N=12 for controls and N=19 for KOs.
(D) Weights of individual fat pads from Adipo-PRDM16 KO and control mice following 18 weeks on HFD. N=11 per group.
Data are presented as mean ± SEM. *, p< 0.05. See also Figure S4.

