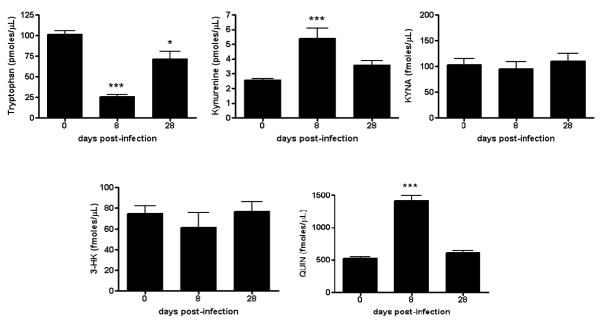
Fig. 2.
Total tryptophan and KP metabolite levels in the serum of T. gondii-infected mice. Analyses were performed as described in Materials and methods. Data are the mean ± SEM of 4-5 animals per experimental group. *p<0.05 and ***p<0.001 vs. uninfected controls (“Day 0”) (one-way Anova with Bonferroni’s post-hoc analysis).

