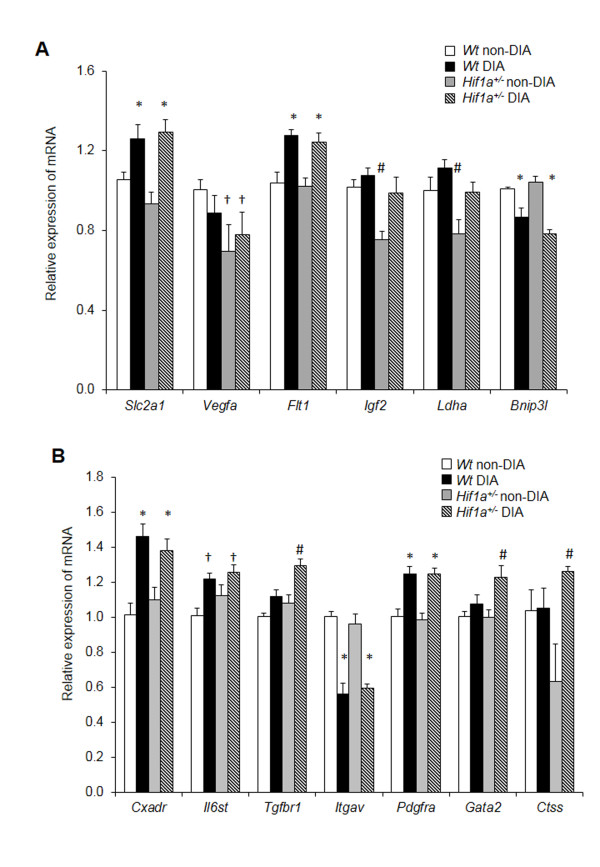
Figure 2.
Gene expression changes in the LV of Wt and Hif1a+/-diabetic mice. The expression of genes was analyzed using RT-qPCR: (A) direct HIF-1α target genes and (B) genes encoding signaling molecules, growth factors, cytokines, and transcription factors. The relative expression levels were quantified using the ΔΔCT method. The data represent the expression of mRNA relative to the non-diabetic Wt expression of mRNA, normalized by the housekeeping mRNA of Hprt1. The values are mean ± SEM (each experiment in duplicate; n = 8). All tests showed a significant effect of diabetes in a 2-way ANOVA, P < 0.01. The effect of genotype was significant in a 2-way ANOVA for Igf2 (P < 0.003), Ldha (P < 0.0001), Tgfbr (P < 0.006), Gata2 (P < 0.01), Ctss (P < 0.05). We identified a condition-genotype interaction (2-way ANOVA interaction effect P < 0.01) for Vegfa. Tukey’s post-hoc multiple-comparison test was used for between-group differences, *P < 0.05 vs. Wt and Hif1a+/- non-diabetics, †P < 0.05 vs. non-diabetic Wt, #P < 0.05 vs. all other groups. Abbreviations: glucose transporter 1 (Slc2a1), vascular endothelial growth factor A (Vegfa), Vegf receptor-1 (Flt1), insulin-like growth factor 2 (Igf2), lactate dehydrogenase A (Ldha), BCL2/adenovirus E1B interacting protein 3-like (Bnip3l), coxsackie virus and adenovirus receptor (Cxadr), interleukin 6 signal transducer (Il6st), transforming growth factor beta receptor I (Tgfbr1), integrin alpha V (Itgav), platelet derived growth factor receptor alpha (Pdgfra), GATA binding protein 2 (Gata2), cathepsin S (Ctss).

