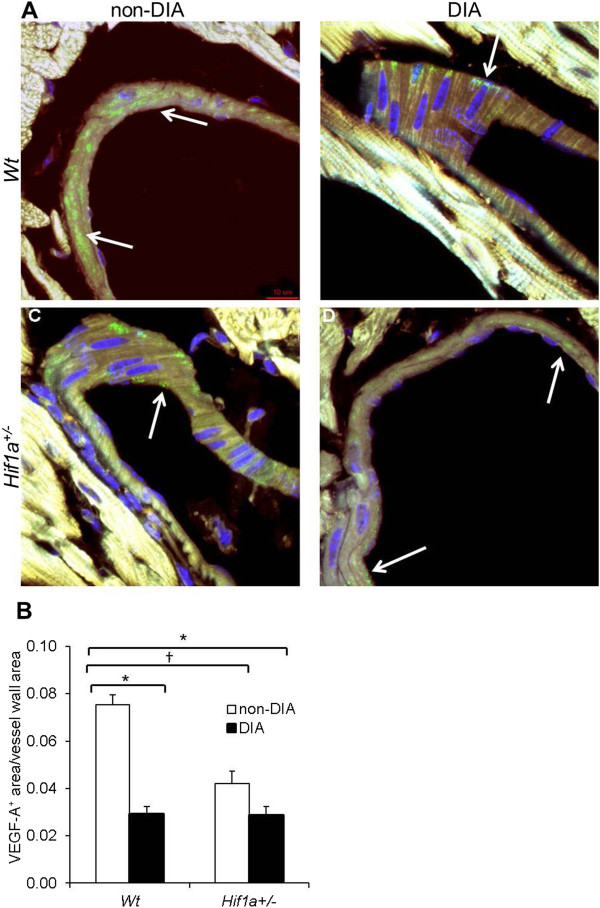
Figure 6.
Diabetes-induced changes in cardiac VEGF-A expression. (A) Confocal imaging of transverse sections of Wt and Hif1a+/- hearts stained with anti-VEGF-A antibody (green) showed VEGF-A expression in coronary blood vessels (white arrow). Hoechst 33342 (blue) was used as a nuclear counterstain. Images are stacked Z-plane sections from confocal microscopy. Scale bar: 10 μm. (B) A relative quantification of VEGF-A expression in the blood vessel wall was performed. The quantification of VEGF-A+ area was determined as a ratio of VEGF-A+ area per total vessel area in the field of view using ImageJ. Data are presented as the mean ± SEM (n = 4 - 8 vessels × 2 individuals per group); †P < 0.01, non-diabetic Wt vs. non-diabetic Hif1a+/-; *P < 0.001, non-diabetic Wt vs. diabetic Wt or diabetic Hif1a+/- (2-way ANOVA with Tukey’s post-test).

