
Figure 3.
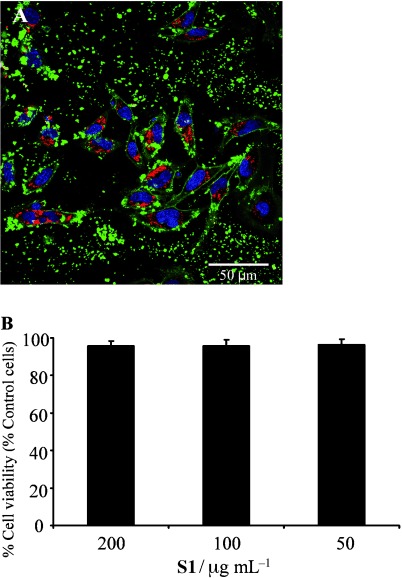
A) Confocal microscopy images corresponding to HeLa cells treated with solid S1 (100 μg mL−1). The cellular uptake of S1 was followed by [Ru(bipy)3]2+ associated fluorescence (red) in the presence of DNA marker Hoechst 33342 (blue) and the plasma membrane marker WGA-AlexaFluor 647 (green). B) For viability studies, cells were treated with S1 and after 24 h incubation, WST-1 reagent was added and cell viability was measured.