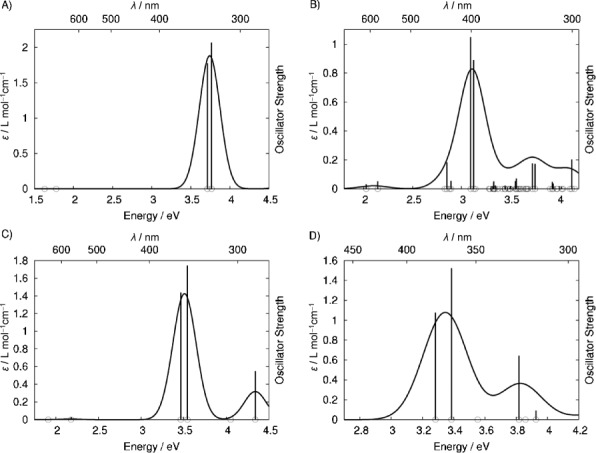
Figure 5.

Calculated ‘stick spectra’ (excitation energies indicated by circles on the abscissa, oscillator strengths plotted as sticks), and Gaussian-broadened absorption intensities of TPP for A) TDHF; B) BP; C) LC-PBE0; D) LC-PBE0-γ* (tuned). Note that all spectra in this work are plotted on an energy scale increasing from left to right. That is, the wavelength increases from right to left, as shown in the wavelength scale at the top of each subfigure.
