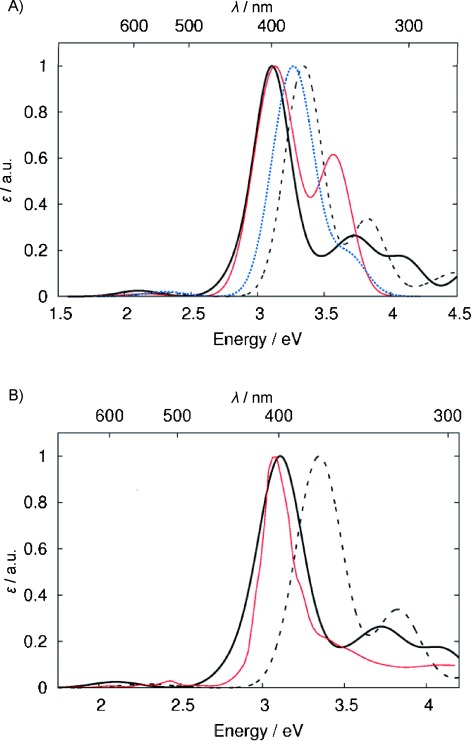
Figure 6.

A) Calculated absorption spectra compared to previously reported theoretical absorption spectra:63, 73 BP (—), tuned LC-PBE0 (- - - -), GW+BSE (—), PBE0 (- - - -). B) Selected calculated spectra compared to experiment:71 BP (—), tuned LC-PBE0 (- - - -), experiment (—). The intensities were scaled such that the Soret peaks have the same intensities.
