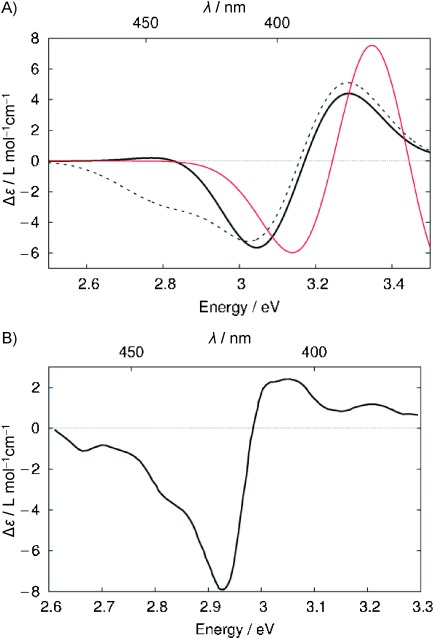
Figure 10.

A) Selected MM spectra for the TPP dimer shown in Figure 7: MM(BP)-QBN (—), MM(BP)-Full (- - - -), MM(LC-PBE0-γ*) (—). The intensity has been divided by 2 for MM(LC-PBE0-γ*). B) Experimental spectrum of BTX-D (—) in MeOH/H2O (4:1) with addition of 0.1 μm CsCl; spectral data are taken from Ref. 11 and converted from a wavelength to an energy scale (see caption of Figure 5).
