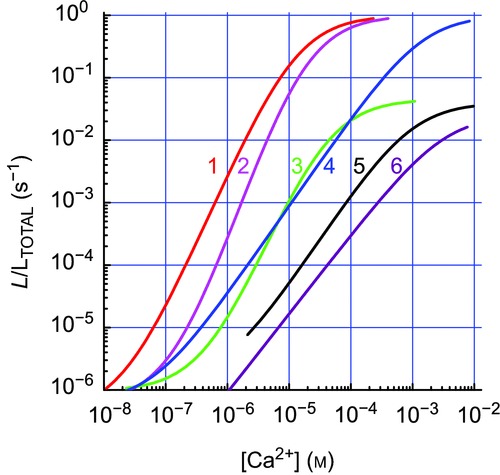
Figure 1.

Different AEQ/coelenterazine pairs cover a broad Ca2+ concentration range with a high gain1, native AEQ + native coelenterazine at 37°C (red); 2, same at 22°C (pink); 3, native AEQ + coelenterazine at 22°C (green); 4, low Ca2+ affinity mutated AEQ at 22°C + native colenterazine (blue) (Montero et al. 2010); 5, GFP fusion to mutated low affinity AEQ + colenterazine at 22°C (black) (Manjarres et al. 2009); 6, low Ca2+ affinity mutated AEQ + colenterazine at 22°C (purple). Light emissions (ordinate) are quantified as rates of photoluminescence emission/total c.p.s remaining at each time and divided by the integration period (L/LTOTAL in s-1).
