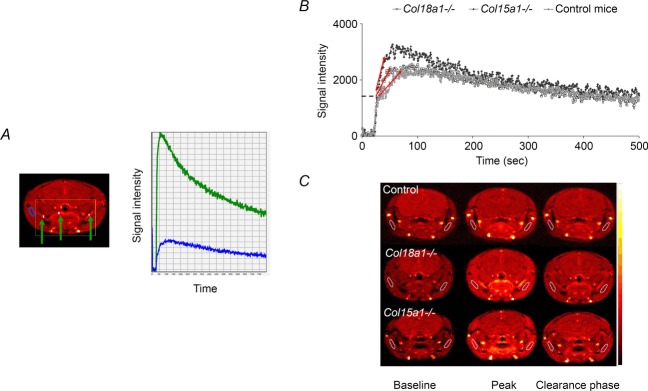
Figure 1.

Signal intensity curves and MR images A, on the right signal intensity curvesfrom larger vessels (green curve) demonstrate the typical time-course of an arterial input curve. A typical SI curve of muscle tissue (blue curve) is shown in the same graph for comparison. Larger vessels are identified as high intensity regions (green arrows, left). B, representative registrations of signal intensity versus time curves from mice in the three groups: control, Col15a1−/− and Col18a1−/− mice. The dashed line marks the step, which is caused by vascular filling. The red arrows indicate the slope of the curves, which represents the tracer accumulation. C, dynamic MR images (pseudocoloured) of representative animals from each group, acquired at different time-points, i.e. baseline before injection, at the peak signal intensity and in the late clearance phase. The muscle ROIs are delineated by white lines and were manually drawn on both sides to include larger parts of the muscle.
