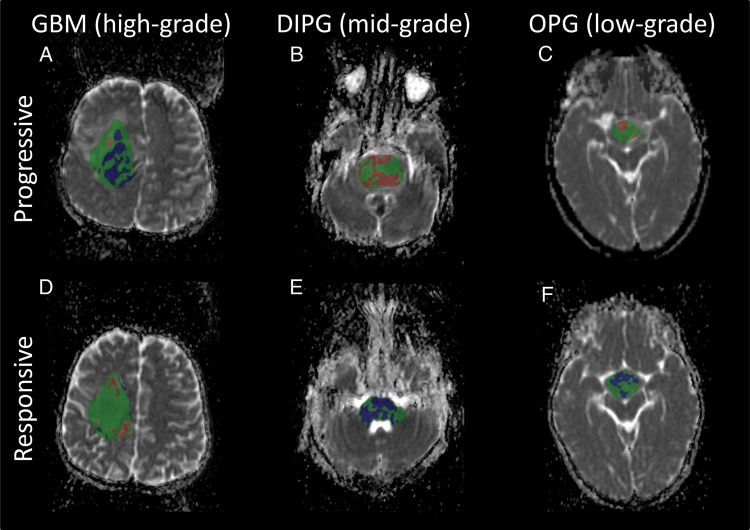
Fig. 5.
The fDM in tumors of varying grade. A comparison is shown of the fDM in GBM (A and D), DIPG (B and E), and OPG (C and F) in areas of progression (top row) and treatment response (bottom row). (A) In high-grade tumors, a decrease in ADC (blue) was indicative of an increase in cellularity and progression. (E and F) In mid- and low-grade tumors, a decrease in ADC was indicative of positive treatment response as high ADC tumor was replaced by healthy tissue. (D) Similarly, an increase in ADC (red) was indicative of positive treatment response in high-grade tumors, and in the above cases (B and C), progression in mid- and low-grade tumors (B and C). Tumor progression and treatment response were defined by a radiologist at the time of second imaging.

