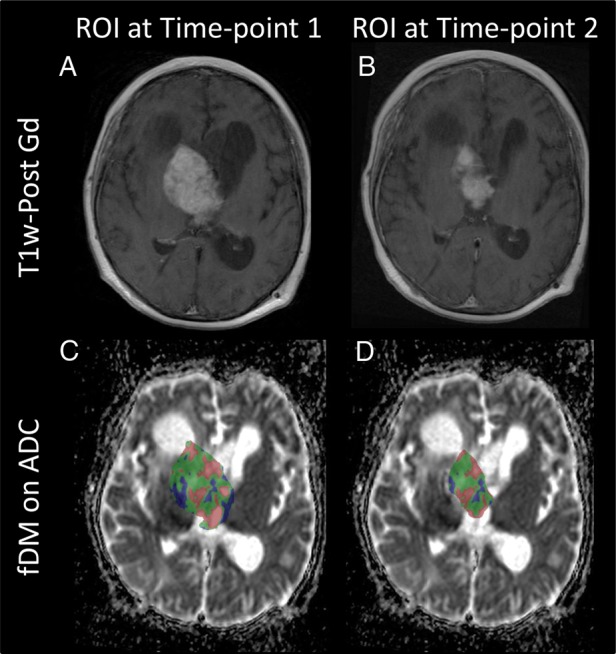
Fig. 6.

Change in tumor size. (A and C) A comparison of the fDM when using a pretreatment mask and (B and D) only the overlap between pre- and posttreatment images is shown in a SEGA patient. The top row shows T1-weighted postcontrast imaging. The bottom row shows the fDM in 1 case, showing (C) a mixture of areas of increased ADC (red) and decreased ADC (blue) when considering the pretreatment mask, and (D) mostly areas of increased ADC when considering the tumor overlap area.
