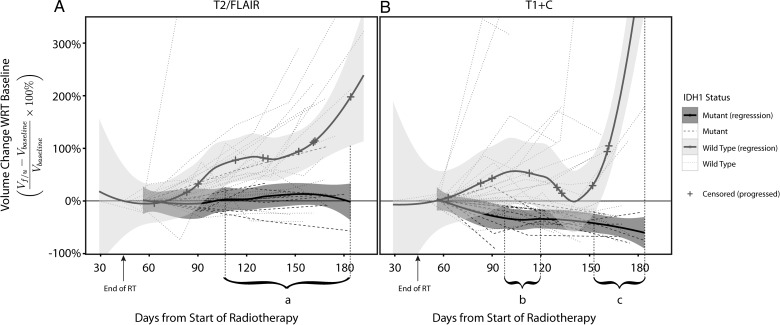
Fig. 2.
Temporal trends of (A) T2/FLAIR hyperintense volume and (B) contrast-enhancing volume in IDH1 mutant versus wild-type glioblastoma. Time series of relative change in VFLAIR and VT1+C volume with regard to baseline scans of each participant were presented. Local polynomial regression trend lines were fitted to IDH1 mutant and wild-type groups separately, and presented with 95% standard error bands. The cross marks on the trend line denoted a participant who had progressed (n = 13 IDH1 wild-type). Periods which IDH1 wild-type had significantly higher growth rate compared with IDH1 mutant are (a) VFLAIR rate from days 105–180, VT1+C rate from (b) days 95–120 and (c) day 150 onwards.

