
Figure 2.
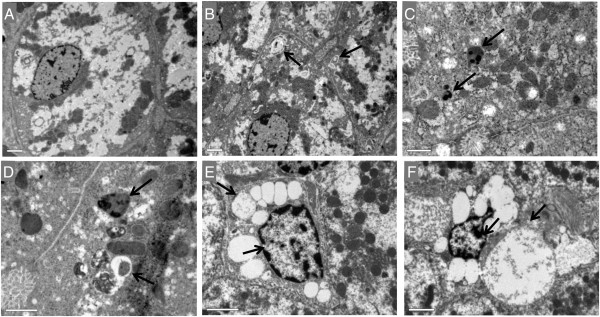
Liver transmission electron microscopy of RHDV-infected rabbits. (A) Control, (B) RHDV 12 hpi; (C) RHDV 18 hpi; (D) RHDV 24 hpi; (E) RHDV 30 hpi; (F) RHDV 36 hpi. Electron micrographs of the liver from control rabbits (A) and infected rabbits (B-F). Normal appearance of hepatocytes was observed in rabbits from the control group (A). Early disease periods (B-D) showed increased levels of lysosomes and mitochondria as well as an augmentation of their density. Images revealed a great number of autophagic vacuoles (black arrows) in different stages. In more advanced disease periods (E-F) the chromatin was condensed and aggregated at the periphery of the nuclear membrane and hepatocytes showed vacuolization of the cytoplasm (black arrows). Original magnification: 5000 – 15 000×.