
Figure 1.
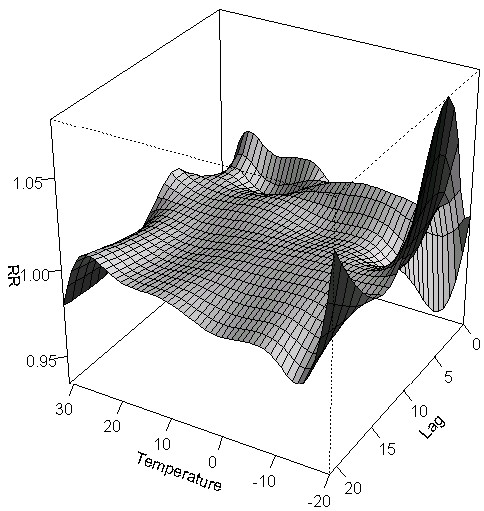
Three-dimensional graph of the relative risks of emergency department visits for cardiovascular diseases by temperature (°C) and lag days in Toronto, Canada.
Official websites use .gov
A
.gov website belongs to an official
government organization in the United States.
Secure .gov websites use HTTPS
A lock (
) or https:// means you've safely
connected to the .gov website. Share sensitive
information only on official, secure websites.
Three-dimensional graph of the relative risks of emergency department visits for cardiovascular diseases by temperature (°C) and lag days in Toronto, Canada.