Figure 2.

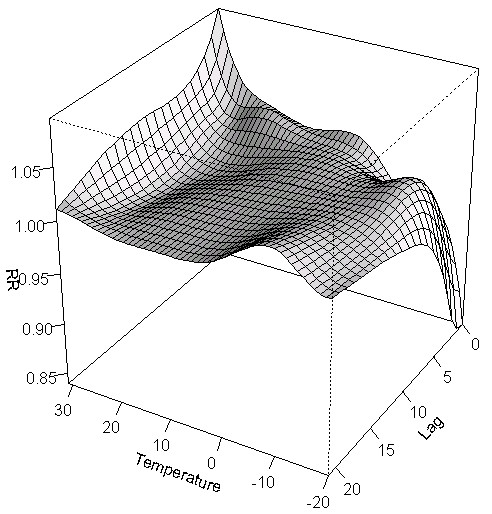
Three-dimensional graph of the relative risks of emergency department visits for respiratory diseases by temperature (°C) and lag days in Toronto, Canada.

Three-dimensional graph of the relative risks of emergency department visits for respiratory diseases by temperature (°C) and lag days in Toronto, Canada.