
Figure 3.
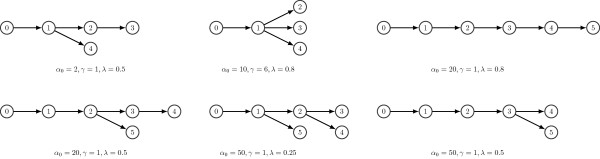
Results on simulated dataset. Best tree structures, i.e., the ones with the highest complete-data likelihood, estimated by PhyloSub with varying hyperparameters for the simulated dataset. We only show a subset of the trees from 90 MCMC runs corresponding to all possible combinations of the hyperparameters used in the simulation.