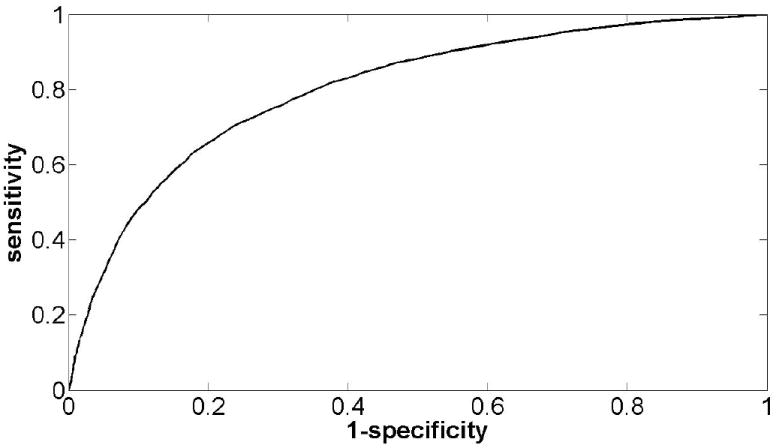
Figure 5. Data-driven motif match threshold selection.

Shown is a sensitivity vs. specificity curve for the PPARγ motif used as a classifier of bound and unbound sequences. A threshold selected to maximize sensitivity while keeping the false-discovery rate below 20% recovers 56% of the bound sequences.
