
Figure 2.
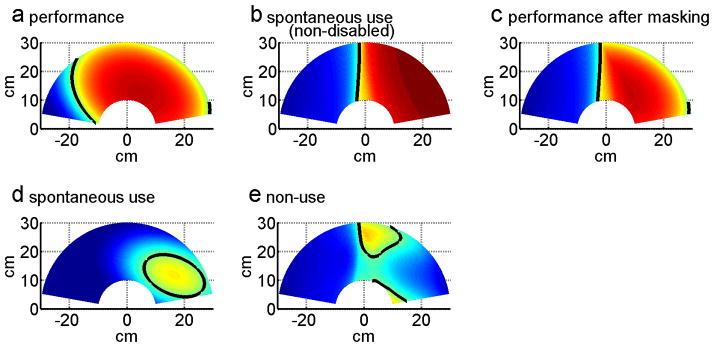
Computing non-use with BART in one session over the 2D reaching workspace for right-affected post-stroke participant ID2, in session 3. (a) Constrained use (performance) probability for ID2. (b) Average spontaneous use probability for right handed non-disabled participants. (c) Constrained use (performance) probability after masking with average healthy subject data of panel (b). (d) Spontaneous use probability. (e) Non-use probability for ID2. Color coding: red = 100% use the paretic arm (right arm for healthy controls), blue = 0% use of the paretic arm. The indifference line, indicated by the thick black line, corresponds to the 50% decision boundary. Note that the non-use probability maps of in (e) is solely for illustrative purpose; it was obtained by subtracting, for each target, the probability of successful reach with the affected arm in the spontaneous condition from the probability of successful reach with the affected arm in the constraint condition.