
Figure A.
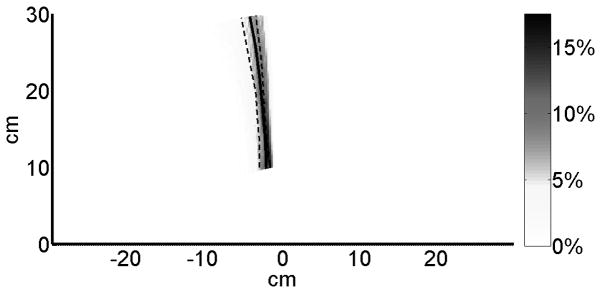
Variability in average indifference lines for non-disabled participants. We obtained a distribution of indifference lines with 1000 bootstrapping samples (draws with replacements) of the non-disabled participants. The original indifference line is shown in solid black and the lower-quartile (25% percentile of decision lines) and upper quartile (75% percentile of decision lines) are shown in dashed black. Yellow color represents higher probabilities of indifference lines.