
Fig 6.
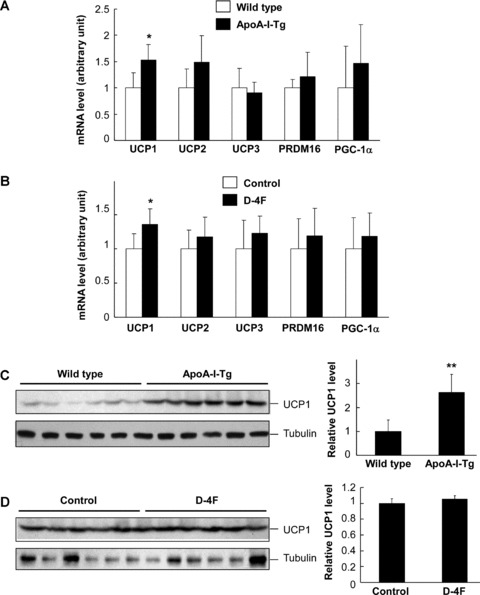
Analysis of gene expression in brown fat tissue of ApoA-I-Tg and D-4F treated DIO mice. The mRNA levels of UCP1, UCP2, UCP3, PRDM16 and PGC-1α were determined by real-time RT-PCR in brown fat tissue of ApoA-I-Tg and wild-type mice (A) and D-4F-treated and control mice (B). The UCP1 protein level was determined by Western blotting using brown fat tissues of ApoA-I-Tg and wild-type mice (C) and D-4F-treated mice and the control mice (D). The brown fat tissue was isolated from overnight-fasted mice. The data were normalized with the level of β-actin for mRNA and tubulin for protein. The right panels for (C) and (D) are semi-quantitative data based on densitometry analysis. The data are shown in mean ± S.D. * indicates P < 0.05 and ** for P < 0.01 as comparison between the two experimental groups in each experiment by Student’s t-test.