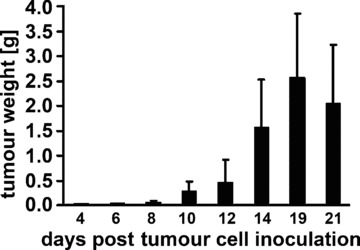
Fig 3.

Tumour growth curve for CT26 colon adenocarcinoma cells in BALB/c mice. Following i.p. injection of tumour cells (2.5 × 10⁴) mice were killed on days 4 (0.03 ± 0.11 g; n= 3), 6 (0.05 ± 0.2 g; n= 3), 8 (0.05 ± 0.03 g; n= 5), 10 (0.29 ± 0.2 g; n= 7), 12 (0.47 ± 0.44 g; n= 7), 14 (1.55 ± 0.9 g; n= 35), 19 (2.6 ± 1.3 g; n= 17), 21 (2.05 ± 1.18 g; n= 10) and tumour weights were determined.
