Fig 5.


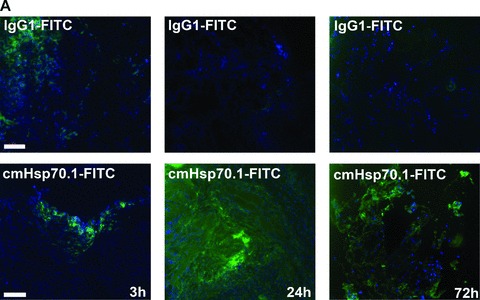
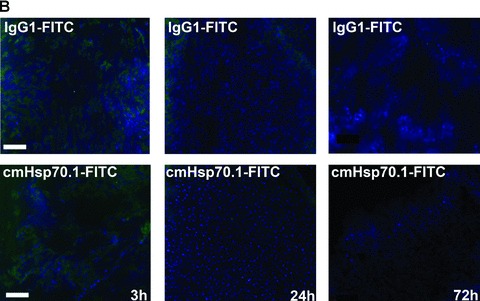
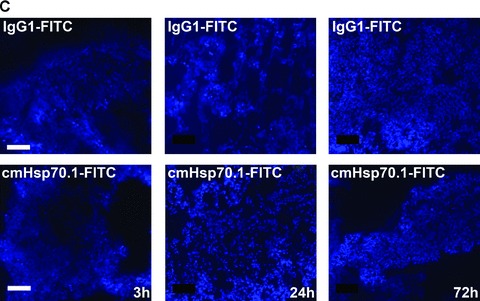
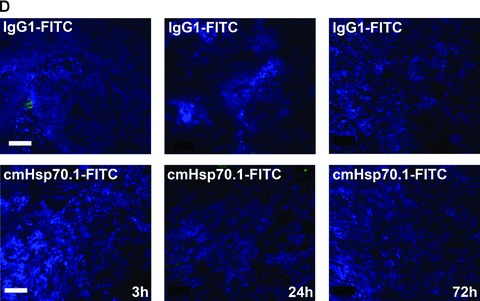
Immunofluorescence analysis of tumour and normal tissue sections. cmHsp70.1-FITC mAb (lower panel) or the identically labelled IgG1 control (upper panel, 100 μg each) was injected into the tail veins of tumour-bearing mice on day 14 after i.p. tumour cell (CT26) injection. Animals were killed 3, 24 and 72 hrs thereafter and the tumour (A), liver (B), lung (C) and kidney (D) were cryo-conserved. Representative views of sections (5 μm) of the tumours and organs were taken at the indicated time-points after the injection of the IgG1-FITC (upper panel) and cmHsp70.1-FITC mAb (lower panel). The nuclei are stained in blue (DAPI) and the localization of Hsp70 is visualized in green (FITC). The scale bar represents 100 μm.
