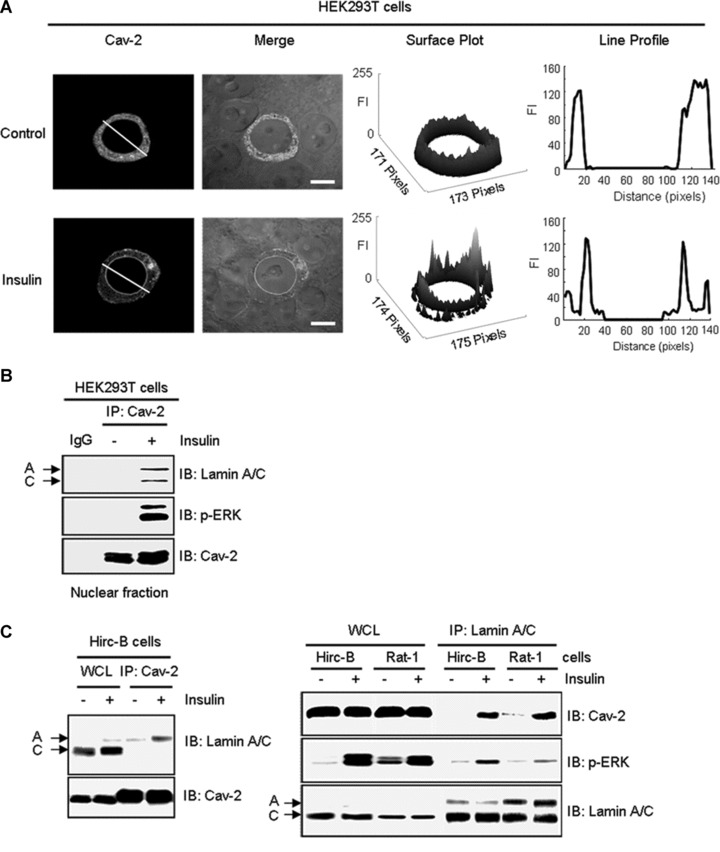
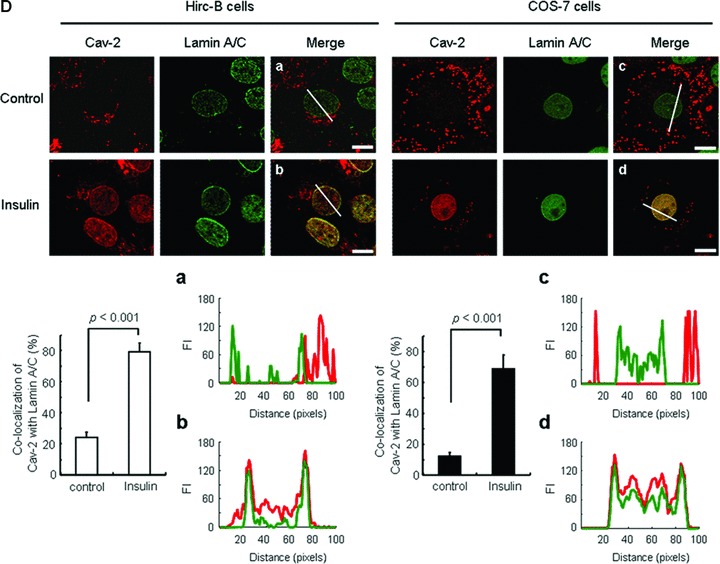
Fig 1.


Insulin-induced interaction between cav-2 and lamin A/C in the inner nuclear membrane. (A) HEK293T cells were transfected with pcDNA-cav-2. Thirty-six hours after transfection, cells were treated with or without insulin (100 nM) for 10 min. Cells were stained with anti-cav-2 antibody followed by TRIRC-conjugated antibody. The cells were visualized by confocal microscopy. Results are representative images of cells from three independent experiments. Grey: cav-2; Merge: cav-2 + DIC. Scale bars: 10 μm. Height of peaks representing cav-2 FI in surface plots illustrates localization of cav-2. Cav-2 FI was measured using the Surface Plotter Plugin of Image J as described under ‘Materials and methods’. The white lines in cav-2 panel were converted to line profiles using the Line Profile Tool of Image-ProPlus 6.1. (B) The cav-2 transfected cells were subjected to nuclear fractionation as described under ‘Materials and methods’. Equal amounts of protein from the nuclear fractions were immunoprecipitated with anti-cav-2 antibody and subjected to SDS-PAGE and immunoblotting with antibodies against lamin A/C, phospho-ERK and cav-2. Shown is a representative experiment that was repeated three times. (C) Hirc-B and Rat-1 cells were treated with or without insulin (100 nM) for 10 min. Whole cell lysates (WCL) were immunoprecipitated with anti-cav-2 or anti-lamin A/C antibodies and subjected to immunoblotting using antibodies specific for cav-2, phospho-ERK and lamin A/C. Shown is a representative experiment that was repeated three times. (D) Hirc-B and COS-7 cells were treated with or without insulin (100 nM) for 10 min. Cells were immunostained with anti-cav-2 and anti-lamin A/C antibodies followed by TRITC- and FITC-conjugated antibodies, respectively, and visualized by confocal microscopy. Results are representative images of cells from three independent experiments. Red: cav-2; Green: lamin A/C; Merge: lamin A/C + cav-2. Scale Bars: 10 μm. Co-localization of cav-2 with lamin A/C in the nuclear envelope was quantified by the Colocalization Finder Plugin of Image J as described under ‘Materials and methods’. The results represent the mean ± S.E. of three independent experiments. (a–d) The white lines in merge panels were converted to line profiles using the Line Profile Tool of Image-ProPlus 6.1. Red line: cav-2; Green line: lamin A/C.
