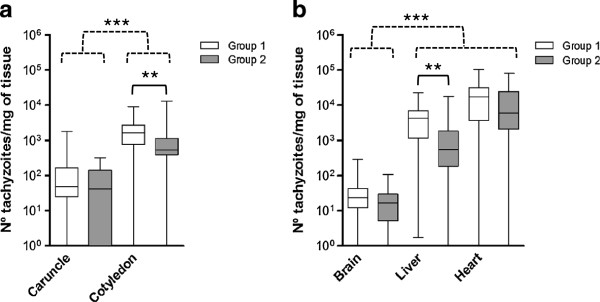
Figure 2.

Median N. caninum burdens in placenta and foetal tissues. Parasite burdens quantified by real-time PCR in placental (a) and foetal tissues (b) from animals inoculated with 107 Nc-Spain7 tachyzoites (G1) and 107 Nc-Spain8 tachyzoites (G2) (see legend). Box-plot graphs represent the median parasite burden (number of parasites per mg of host tissue), the lower and upper quartiles (boxes) and minimum and maximum values (whiskers). Taking into account that the N. caninum detection limit by real-time PCR is 0.1 parasites, all positive samples had > 10-1 parasites, and negative samples (0 parasites) were represented on the log scale as < 10-1 parasites. (**) over continuous-line brackets indicates significant differences between infected groups in each tissue; P < 0.01. (***) over discontinuous-line brackets indicates significant differences between placental and foetal tissues in each infected group; P < 0.001.
