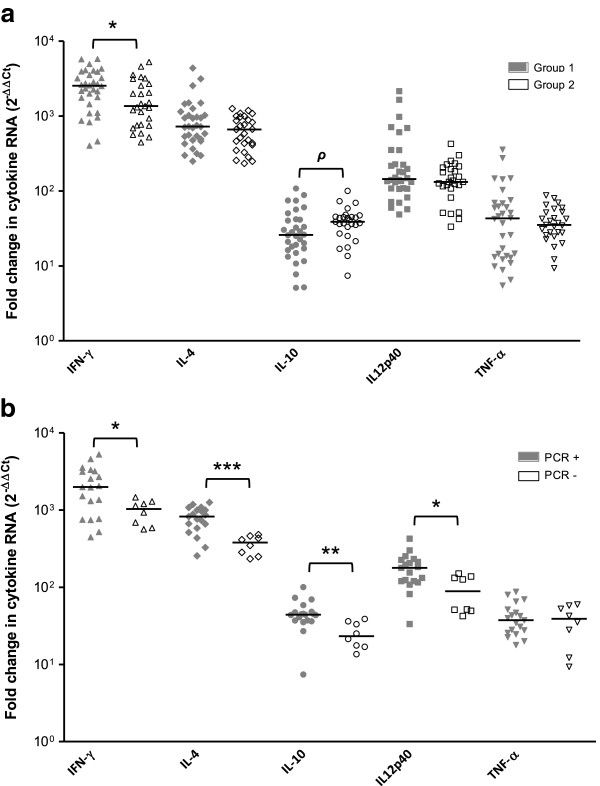
Figure 5.
Cytokine expression profiles in the placenta. Scatter-plot graphs of relative cytokine expression levels (as x-fold change) in infected caruncles from heifers inoculated with 107 Nc-Spain7 tachyzoites (G1), 107 Nc-Spain8 tachyzoites (G2) (a) and PCR-positive and PCR-negative caruncles from G2 (b). Horizontal lines represent median values for each group. (*) indicates P < 0.05, (**) P < 0.01, (***) P < 0.001 and (ρ) a trend towards significant differences between infected groups (a) or between PCR + and PCR- caruncles from G2 (b).

