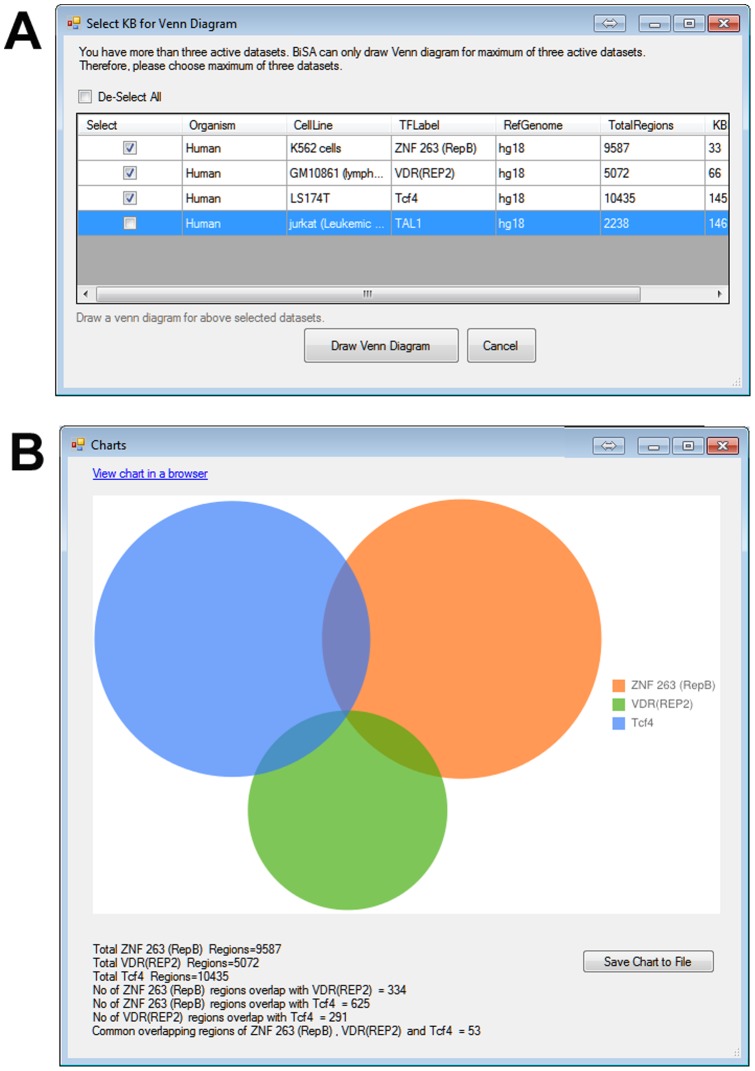
Figure 4. Venn diagrams.
BiSA can cross-compare a maximum of three active KB as a Venn diagram. (A) If there are more than three active datasets then a pop-up window appears that allows the investigator to select three datasets to be analysed. (B) Google Charts is used to draw Venn diagrams. The diagram can be saved as a high quality PNG file.

